

Fixing Funnel Friction
CASE STUDY PREVIEW & SUMMARY
- Context: An end-to-end user journey mapping and marketing acquisition analysis conducted on a relational database tracking over 1.7 million analytical records.
- The Challenge: Identifying hidden behavioral drop-off points along the conversion funnel and determining why high-volume paid traffic channels fail to generate proportional transaction numbers.
- Key Findings: The primary growth bottleneck occurs early in the experience, where 64% of product page viewers drop off before adding items to a cart. While paid search provides volume (67% of traffic), highly focused social campaigns demonstrate peak conversion efficiency.
For modern e-commerce enterprises, securing steady traffic is only a baseline metric. Long-term commercial success requires a clear understanding of the digital customer journey—from the initial landing page down to the completed transaction. Without granular tracking, businesses risk over-investing in low-efficiency channels while ignoring deep friction points in their core user experience.
The objective of this analysis was to clean and transform a relational database containing over 1.7 million rows of session, pageview, and product information into an actionable operational framework. The study addresses an explicit corporate challenge: diagnosing why high baseline traffic volumes were not translating into optimized transaction rates or maximum marketing return on investment (ROI).
Technical Methodology & Funnel Engineering
To create a reliable analytics infrastructure, raw transactional activity was structured into a session-level funnel dataset using optimized SQL procedures:
- Data Integration: Combined chronological pageview streams directly with unique web session metadata to track navigation patterns.
- Feature Engineering: Developed custom binary flags at the session level to verify whether a user successfully progressed through the four core stages of the conversion funnel:
- Product View: The user moved past general landing grids to a specific product page.
- Cart Addition: High-intent behavioral addition of items into the shopping cart.
- Checkout Entry: The user entered the payment and billing processing portal.
- Purchase: Completed order placement and successful transaction verification.
- Channel Segregation: Aggregated the session indicators to compare traffic sources side-by-side, evaluating the true cost and conversion quality across different channels.
High-Level Conversion Funnel Metrics
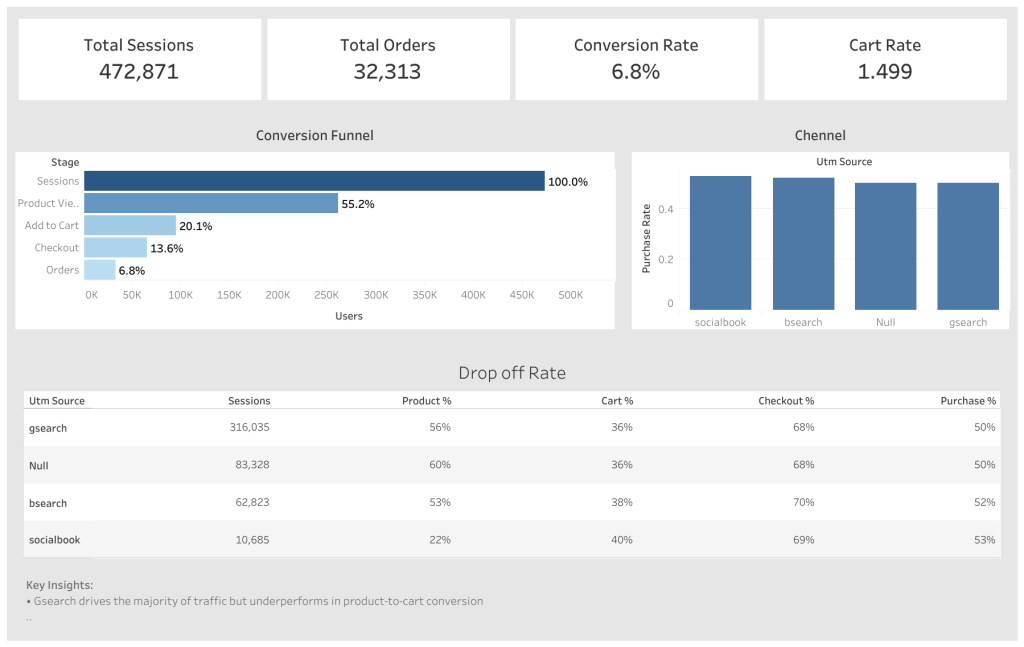
Evaluating 472,871 unique user journeys revealed exactly how traffic flows through the platform:
- Baseline Traffic: 472,871 sessions
- Product Interaction Rate: 261,231 sessions (55% progression rate)
- Cart Addition Rate: 94,953 sessions (36% of product viewers)
- Formal Checkout Entry: 64,484 sessions (68% of cart interactors)
- Completed Transactions: 32,313 final orders (50% of checkout users)
Deep Strategic Insights
The data pipeline uncovered four critical insights regarding user behavior and channel efficiency:
- The Product Page Retention Bottleneck: The single largest point of failure in the user journey occurs immediately after a product view. A staggering 64% of users drop off before adding a single item to their cart. This indicates clear friction on the product pages, such as hidden delivery costs, weak trust signals, missing product descriptions, or broken layout mechanics.
- Paid Search Volume vs. Efficiency Mismatch: Google Search (Gsearch) is the platform’s dominant driver of scale, accounting for ~67% of all website traffic. However, it shows weak conversion efficiency in the early stages of the funnel. This points to broad keyword targeting that attracts casual browsers rather than high-intent buyers.
- Social Campaign Performance: Niche social campaigns (Socialbook) represent just ~2% of total traffic but achieve the highest conversion rates across every stage of the funnel. This high conversion rate proves that precise social targeting delivers highly qualified buyers.
- Strong Organic Intent from Direct Traffic: Direct and unknown traffic channels demonstrate excellent baseline product page engagement. This indicates high brand familiarity, making this cohort a prime target for high-return email and remarketing campaigns.
Strategic Recommendations & Operational Playbook
To translate these findings into an immediate market advantage, the following actions were recommended:
- Optimize the Product Page Experience: Focus development resources on reducing the 64% product-to-cart drop-off rate. Deploy A/B testing on pricing layouts, improve description clarity, add clear trust signals, and remove UX friction points.
- Refine Paid Search Keyword Matching: Shift Gsearch budgets away from broad keywords and toward long-tail, high-intent queries. Realign landing pages to better match ad copy and improve early funnel retention.
- Scale Capital Investment in Social Campaigns: Allocate more budget to high-efficiency social channels like Socialbook. Replicate these successful targeting strategies across lookalike audiences to drive cost-effective conversions.
- Build Direct Traffic Retargeting Flows: Set up automated custom retargeting sequences and tailored email flows for direct visitors to capitalize on their strong brand familiarity and drive repeat purchases.
Conclusion
This case study proves that the platform’s primary growth restriction is not caused by checkout or payment processing issues. Instead, conversion rates are limited by early funnel drop-offs. By optimizing product pages and shifting marketing spend toward high-performing channels, the business can fix early funnel leaks, lower acquisition costs, and maximize overall return on investment.