

Retail Data to Strategic Insights
CASE STUDY PREVIEW & SUMMARY
- Context: A professional analytics initiative designed to transform unstructured retail transactional logs into an operational intelligence dashboard assessing performance across time, product categories, regions, and consumer segments.
- The Challenge: Overcoming data silos and inconsistencies to identify localized growth vectors, prominent seasonal demand drops, and underlying customer concentration risks.
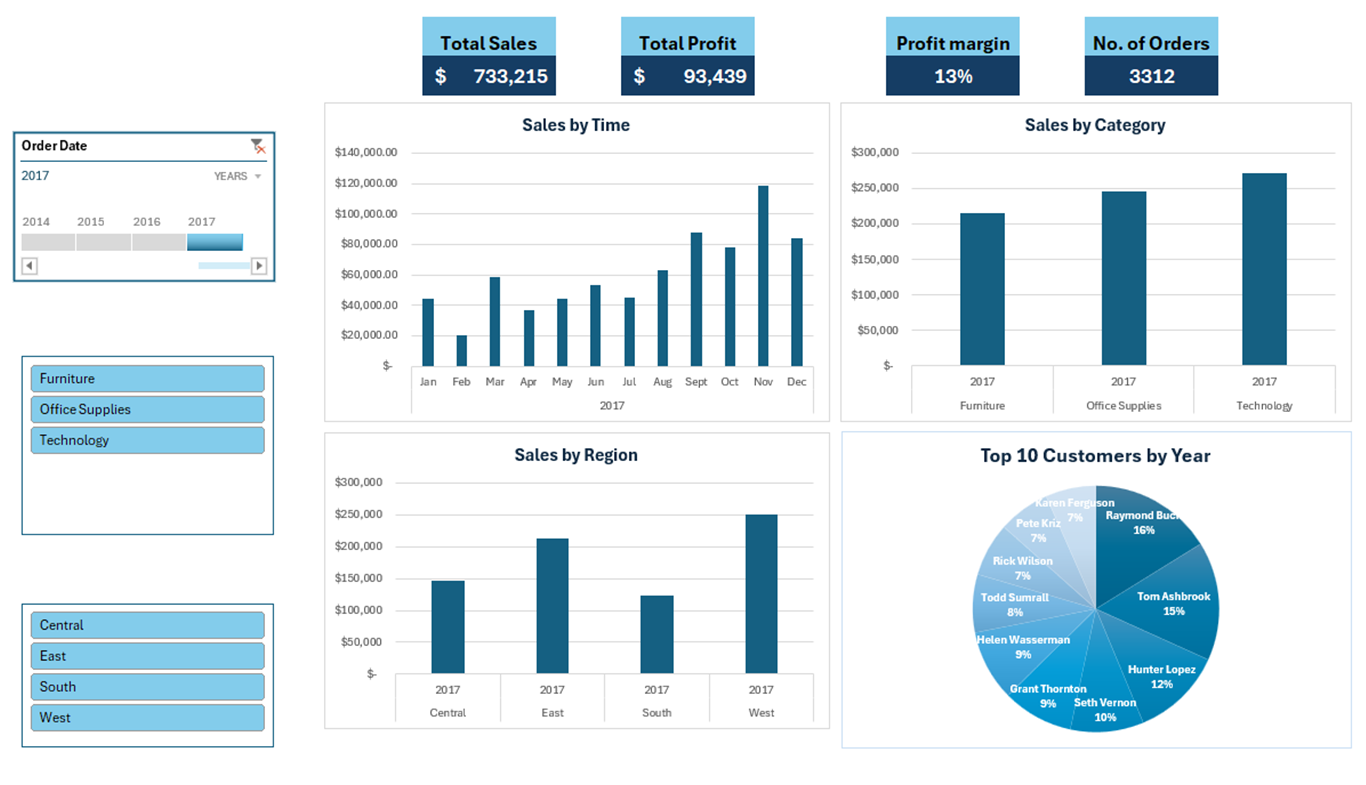
- Key Findings: Evaluated $733,215 in total sales and $93,439 in profit across 3,312 individual orders, establishing a framework to optimize inventory allocation, target marketing spend, and de-risk client dependencies.
Project Background & Business Challenge
In modern retail, capturing transactional logs is effortless, but extracting meaningful guidance from them requires deliberate engineering. This project addresses a common organizational challenge: an enterprise operating across multiple regions and product segments without an unified, reactive mechanism to evaluate growth drivers or underlying financial risks.
The objective of this project was to take a complex, multi-variable transactional dataset, sanitize its structure, and build a high-fidelity business intelligence tool. The ultimate goal was to move from retrospective data viewing to forward-looking, data-driven strategy formulation.
Analytical Approach & Methodology
The solution was executed across a rigorous workflow to ensure analytical integrity and scalability:
- Data Sanitization & Engineering: Cleansed the primary database to enforce data consistency and usability. Created granular chronological feature variables (including specific month and fiscal year indicators) to allow for precise trend and seasonality analysis.
- Interactive Dashboard Architecture: Using advanced data modeling principles in Excel, a dynamic, multi-dimensional user interface was constructed. By integrating custom pivot architectures with interactive filtering slicers (such as order dates, regions, and product categories), stakeholders were granted the ability to dynamically segment core metrics.
- Exploratory Data Analysis (EDA): Applied comprehensive descriptive and statistical techniques to isolate underlying operational trends, market anomalies, and revenue performance drivers.
Analytical Approach & Methodology
- Total Revenue: $733,215
- Total Retained Profit: $93,439
- Aggregate Profit Margin: 13%
- Total Order Volume: 3,312 orders
Core Strategic Insights
The analysis unmasked several hidden dynamics that were previously obscured within the raw transactional lines:
- Resilient Chronological Growth: Looking at performance from 2014 to 2017, the business exhibits a strong, long-term upward trajectory. A temporary contraction in 2015 was systematically corrected in subsequent fiscal years, pointing to structural resilience.
- Pronounced Demand Seasonality: Highly distinct demand peaks consistently manifest in March, September, November, and December. These fluctuations highlight clear consumer buying rhythms and major end-of-year holiday shopping spikes.
- Product Category Dominance: The Technology sector consistently acts as the primary engine for high-value revenue. Conversely, Furniture demonstrates localized, period-specific spikes, pointing to selective optimization potential rather than baseline strength.
- Regional Asymmetry: Market performance is heavily dependent on the West and East regions. The West serves as the premier geographic volume driver for the business.
- Client Concentration Risk: Customer segmentation models revealed a tight concentration of total sales among a small, highly consolidated group of buyers. This highlights a structural vulnerability, creating a critical operational risk if churn occurs within these top tiers.
Strategic Recommendations & Business Impact
To translate these analytical findings into an operational advantage, the following strategic changes were formulated:
- Maximize Product ROI: Align corporate marketing budgets and product promotions directly with high-velocity sectors, particularly expanding the footprint of high-margin Technology lines.
- Synchronize Inventory with Peak Rhythms: Transition the supply chain from reactive ordering to predictive staging, matching stock levels with the predictable demand surges in March, September, and Q4.
- Geographic Capital Allocation: Double down on dominant positions in the West and East through localized customer retention programs while introducing operational interventions to stabilize underperforming territories.
- De-risk Customer Dependency: Deploy defensive client-management frameworks to retain high-value accounts, while simultaneously launching diversified acquisition campaigns to broaden the customer base and mitigate concentration risk.
Final Conclusion & Outcome
The resulting deliverable replaces historical business intuition with dynamic operational oversight. By embedding complex transactional logic beneath a clean, accessible presentation layer, stakeholders are equipped to immediately run exploratory deep-dives, track regional shifts, and execute confident, data-driven decisions that safeguard margins and drive sustainable growth.
This advanced predictive modeling and revenue management initiative used supervised machine learning on a 5,000-flight dataset from Dubai to analyze drivers of passenger volume, price elasticity, and marketing efficiency. Findings revealed price-inelastic demand, indicating latent pricing power, while an advanced Random Forest model mapped non-linear interactions to vastly outperform standard linear metrics.