

RFM Segmentation & CLV
CASE STUDY PREVIEW & SUMMARY
- Context: An advanced behavioral segmentation pipeline engineering project using Python and Tableau to analyze ~540,000 international e-commerce transactions.
- The Challenge: Handling a heavily right-skewed transaction distribution filled with extreme spending outliers and duplicate quartile boundaries to cleanly isolate high-value brand advocates from churned users.
- Key Findings: Unsupervised machine learning ( K-Means, k = 3) divided ~4,300 unique buyers into distinct operational personas, revealing a massive short-term £130,000 revenue recovery opportunity hiding within a dormant “At-Risk” cohort.
Project Background & Business Context
In modern retail operations, treating a vast, diverse user base as a single, uniform entity leads directly to inefficient ad spend, poor customer experiences, and high churn rates. Mass marketing blasts routinely over-invest in low-intent, single-purchase buyers while failing to sufficiently protect high-value customers who generate the bulk of the company’s revenue.
This project was built to solve that exact problem by extracting clear, behavioral segments from an Online Retail dataset tracking ~540,000 granular transactions. By transforming raw sales data into actionable customer profiles, this pipeline allows marketing teams to replace generic ad blasts with personalized retention strategies, protect core assets, and efficiently recover lost revenue.
Technical Methodology & Engineering Pipeline
The end-to-end analytical framework was divided into four distinct technical steps:
- Data Engineering & Preparation: Ingested raw transaction data using specific handling for byte-order mark (BOM) characters introduced by Excel CSV exports. Cleaned data by explicitly parsing date strings, calculating a derived revenue metric (
), and filtering out guest checkouts, order cancellations, and price adjustments.
- RFM Aggregation: Grouped transactions at the customer level relative to a strict evaluation snapshot date to engineer three core features: Recency (days since last transaction), Frequency (total distinct invoices), and Monetary (total gross lifetime expenditure).
- Quartile Binning & Scoring: Divided customers into performance tiers from 1 to 4. To handle the high volume of one-time buyers causing duplicate bin edges in the frequency column, a rank-based fallback mechanism was integrated to maintain analytical balance.
- Unsupervised Clustering (K-Means): Standardized behavioral vectors before passing them to a clustering algorithm. Used the Elbow Method across ranges of k=2 to k= 8 to isolate k =3 as the mathematical sweet spot for interpretable customer personas.
High-Level Project Metrics
- Total Cleaned Scope: ~540,000 global transactions across ~4,300 unique buyers
- Total Evaluated Revenue: £8.2 Million across all historical segments
- Average Historical Network Recency: 37 days since last purchase
- Optimal Model Complexity: k = 3 distinct clusters
Customer Persona Profiles & Behavioral Insights
- High-Value (~600) ■■■■■■
- At-Risk (~1,500) ■■■■■■■■■■■■■■■
- Low Eng. (~2,000) ■■■■■■■■■■■■■■■■■■■■
The machine learning architecture successfully mapped the customer base into three highly distinct behavioral personas:
High-Value Cohort (~600 Customers)
- Behavioral Footprint: Average Recency of 18 days, Frequency of 9.3 orders, and an outstanding average Monetary spend of £4,822.
- Strategic Reality: This power-law cluster represents the economic core of the company. Making up just ~14% of the customer base, they generate the vast majority of the company’s £8.2M gross revenue. The primary business goal for this group is preventing churn.
At-Risk Segment (~1,500 Customers)
- Behavioral Footprint: Average Recency of 90 days, Frequency of 2.1 orders, and an average Monetary spend of £432.
- Strategic Reality: These buyers have a solid history of spending but have completely flattened out over the last quarter. This group represents the single largest short-term financial recovery opportunity for the business.
Low Engagement Cohort (~2,000 Customers)
- Behavioral Footprint: Average Recency of 242 days, Frequency of 1.2 orders, and a low average Monetary spend of £98.
- Strategic Reality: This is a large block of low-intent, single-purchase buyers. Pouring expensive, manual marketing resources into this group yields a poor ROI, making low-cost automation the only sustainable choice.
Strategic Operational Recommendations
Based on the behavioral insights surfaced by the model, the following sequential playbooks were deployed:
Immediate Priority (0–30 Days)
- Launch an Automated Win-Back Sequence: Target the At-Risk segment with a multi-stage re-engagement email flow featuring a 15% promotional incentive with a strict 14-day expiration window. Recovering just 20% of this high-intent segment yields an estimated £130,000 in immediate revenue.
- Deploy a Defensive Loyalty Program: Protect high-value assets by enrolling top-tier customers into an exclusive loyalty program offering early product access and dedicated support to increase switching costs.
Medium-Term Strategy (30–90 Days)
- Construct a Refresh Data Pipeline: Automate data flows to rerun the Python clustering pipeline against fresh transaction logs monthly. Build automated alerts to flag when an active High-Value customer shifts down into an At-Risk status.
- Establish Segment-Specific CRM Mapping: Create distinct email communication tracks for each segment. Tailored messaging at the segment level outperforms generic email strategies by 3–5× in comparable retail environments.
Long-Term Evolution (90+ Days)
- Refine Model Complexity (k = 4): As win-back campaigns mature, expand the clustering model to isolate a fourth unique cluster (e.g., separating “Promising New Buyers” from low-intent users).
- Integrate Scores into Product Engines: Connect the RFM scores to the digital store’s recommendation engine—serving premium items to High-Value buyers, and historical favorites to At-Risk customers to spark repeat purchases.
Dashboard Infrastructure & Technical Artifacts
To help non-technical stakeholders quickly visualize and act on these insights, the underlying data was compiled into an interactive Tableau dashboard.
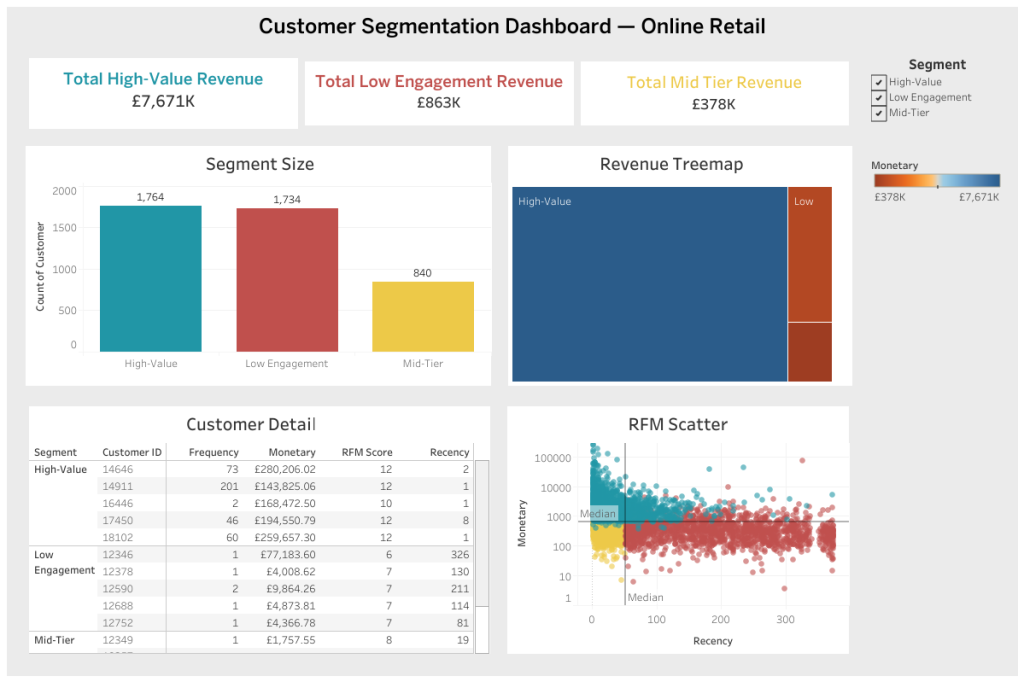
The visual design relies on several key features to make the data highly readable and clear at a glance:
- Logarithmic Spend Scaling: Applied a log transform to the Monetary axis on the user scatter plot, converting unreadable outlier clustering into a clear, scannable chart.
- Robust Median Reference Lines: Replaced easily skewed average metrics with median reference lines to create balanced quadrants that reflect true performance midpoints.
- Global Drill-Down Filtering: Integrated interactive segment actions, allowing stakeholders to cross-filter across sizes, revenue treemaps, and localized top-5 customer lists in real time.
Technical Limitations Note: This model evaluates a 13-month time window, meaning Q4 holiday shopping spikes may artificially inflate the recency scores of seasonal buyers. Unidentified guest checkouts were also removed from the pipeline, leaving an unmapped volume of transaction revenue.